
Editing a Widget
You can adjust how a widget appears on your screen by editing it. Here’s how to edit a widget:
Open the “Format Widget” window
To format a widget, you will need to open the Format widget window. This is how to open it:
- Click Dashboards on the sidebar.
- Click the targeted dashboard tab.
- Select the targeted widget within a dashboard, and click the ⋮ (three-dot) icon on the right.
- Click Format widget.
Editing a Widget
Underneath are the key editing options for various widgets:
Note: No single widget in Azumuta has all of these editing options. Each widget only has a few of these editing options. The list below is merely a compilation of the most commonly found editing options.
Changing a Widget’s Title
- Type in the new widget title on the Format widget window.
- Click Save.
- Click Yes.
Hiding and Showing Legends in a Widget
Legends are an element that explains what a particular color stands for in a graph. The image below is a good example.
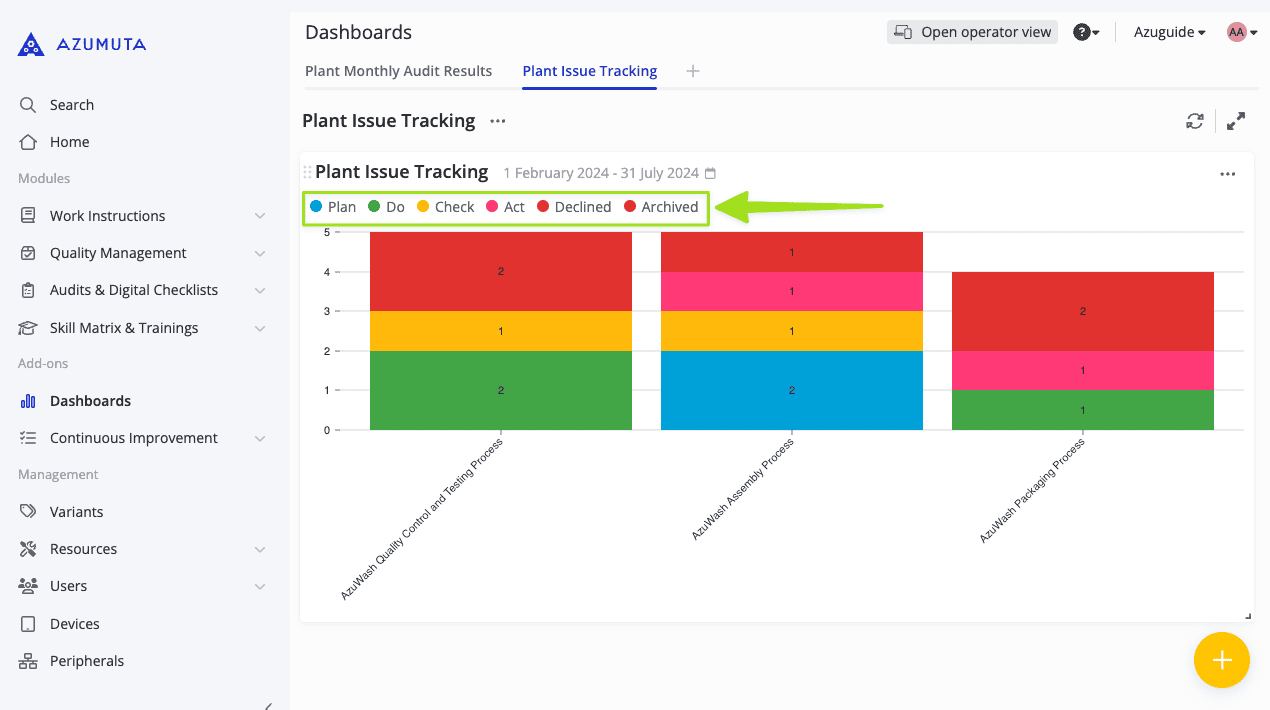
Here’s how to hide or show graph legends:
- To hide them: Untick the box next to Show legends.
- To show them: Tick the box next to Show legends.
- Click Save.
- Click Yes.
Setting the Maximum and Minimum Boundaries of the Widget’s Y-Axis
The y-axis in a graph is the vertical axis that runs from the bottom to the top. They represent a numerical value. This is where the Y-axis stands on a widget:
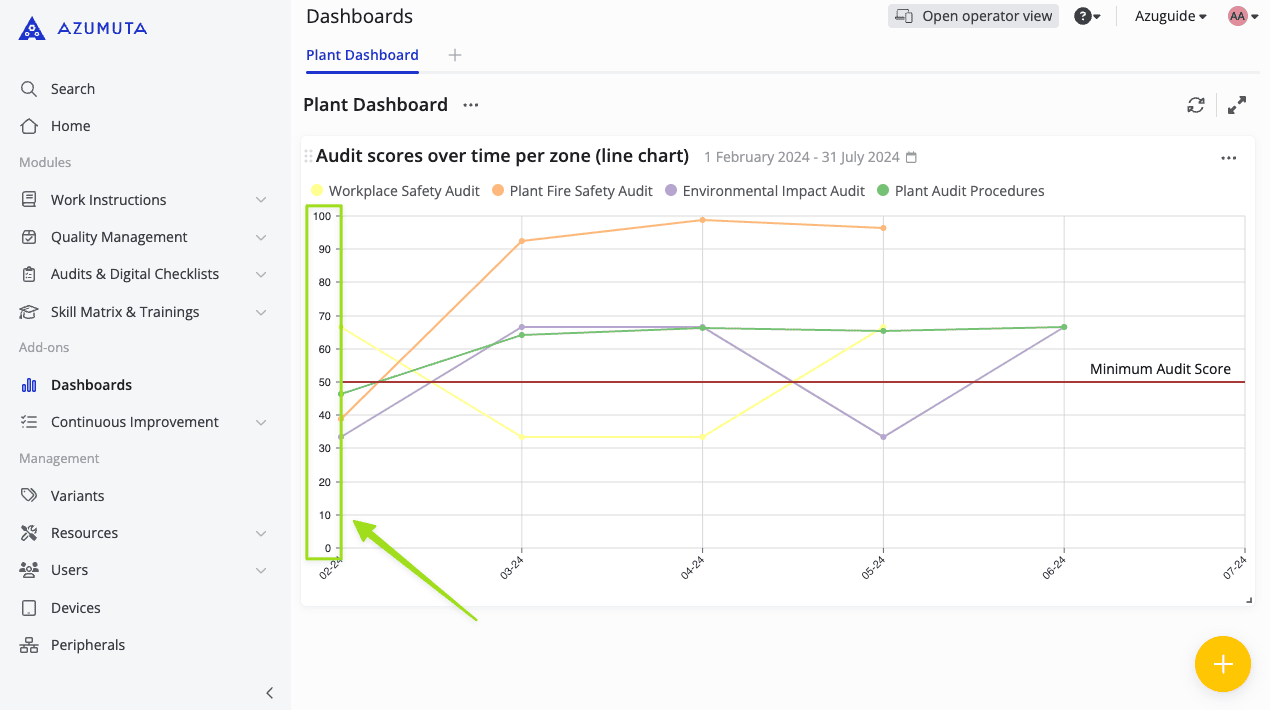
The higher we go in the y-axis, the higher the value is. While vice versa, the lower we go in the y-axis, the lower the value is.
You can adjust the maximum (the ceiling) and/or the minimum (the bottom) values of the graph by following these steps:
- Under Y-axis bounds, make sure that Value is ticked instead of Automatic.
- Input the desired values.
- Click Save.
- Click Yes.
Adding and Editing a Marker
A marker is a horizontal line that passes through a graph. A marker is generally used as a target or a minimum score indicator. In the image below, the brown line on the graph that says “Minimum Audit Score” is the marker.
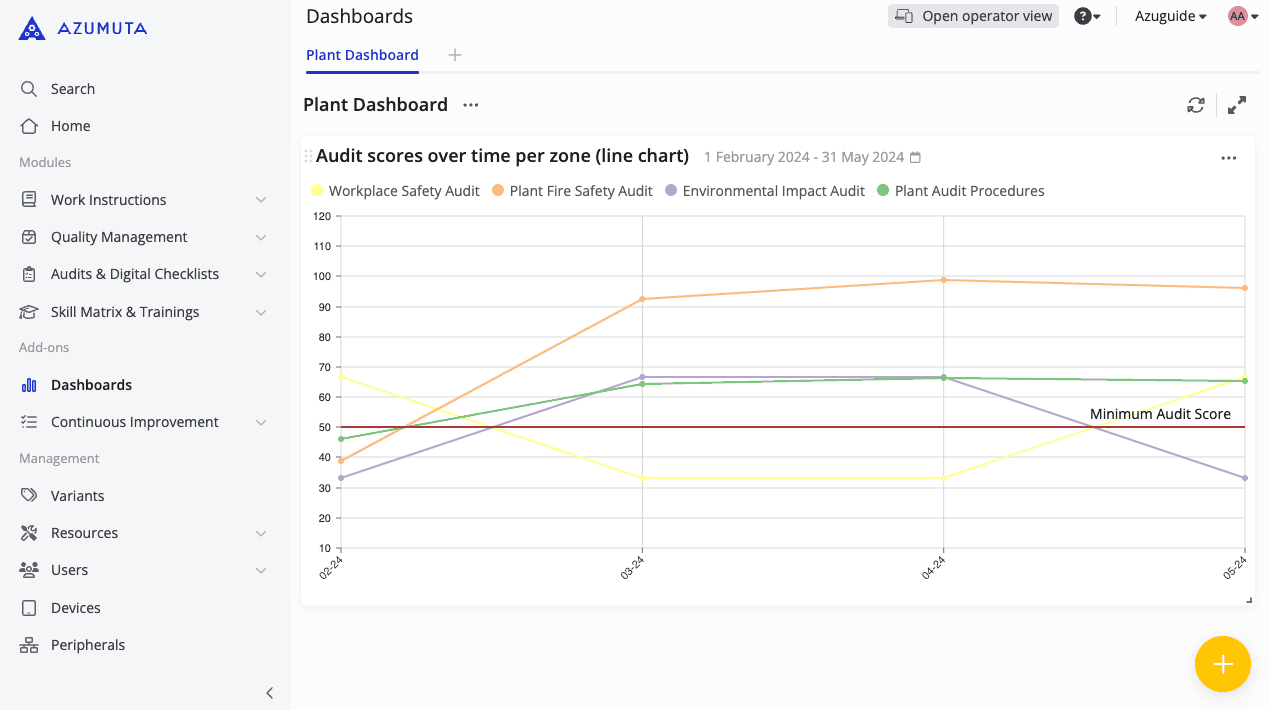
Add a new marker
- Click Add new marker.
- Write the marker’s label.
- Set the marker’s value.
- Click Save.
- Click Yes.
Edit an existing marker
- Edit the marker’s value and/or the label on the Format widget window.
- Click Save.
- Click Yes.
Delete an existing marker
- Click the trash can icon next to the marker that you wish to delete.
- Click Save.
- Click Yes.
Hiding and Showing a Total Value in a Widget
Some widgets display the total value of the numerical data that it displays, such as the example below:
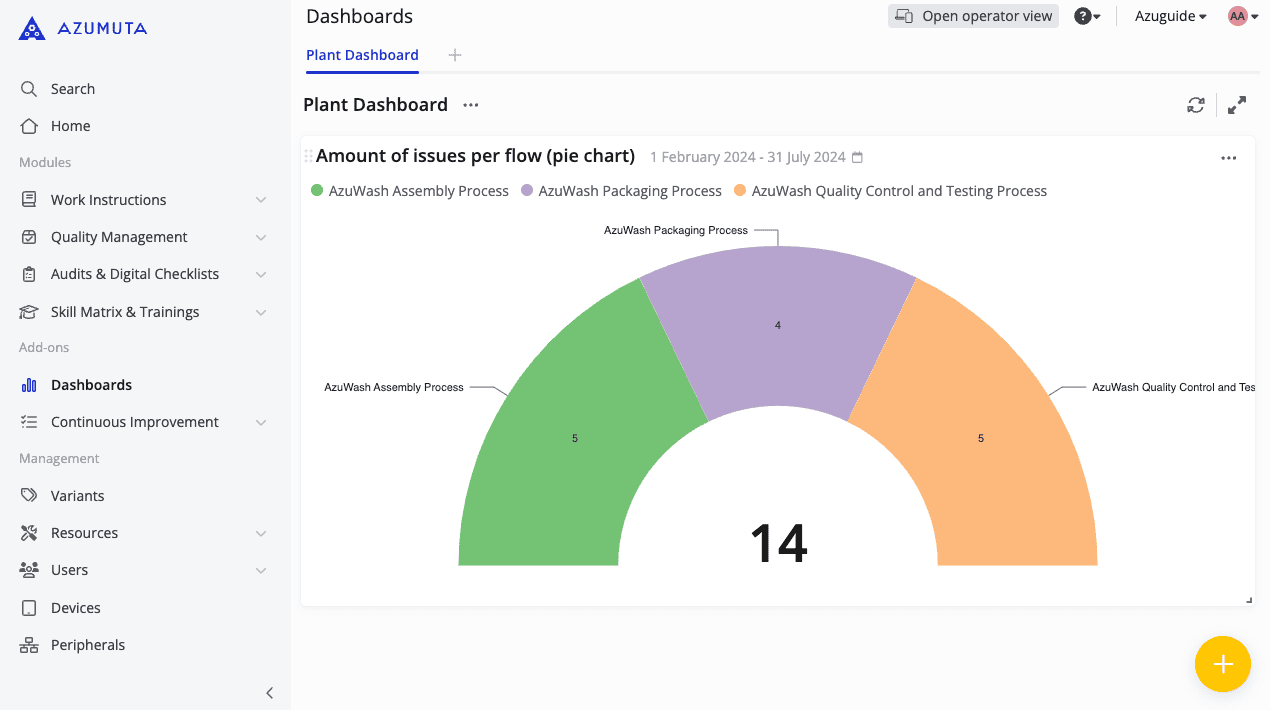
You can hide or show that total value by following these steps:
- To hide the total value: untick the box next to Centered total metric.
- To show the total value: tick the box next to Centered total metric.
- Click Save.
- Click Yes.